OpeOluwani Akintayo
16 November 2017, Sweetcrude, Lagos — The Organisation of the Petroleum Exporting Countries, OPEC, has increased global economic growth by 2 percent.
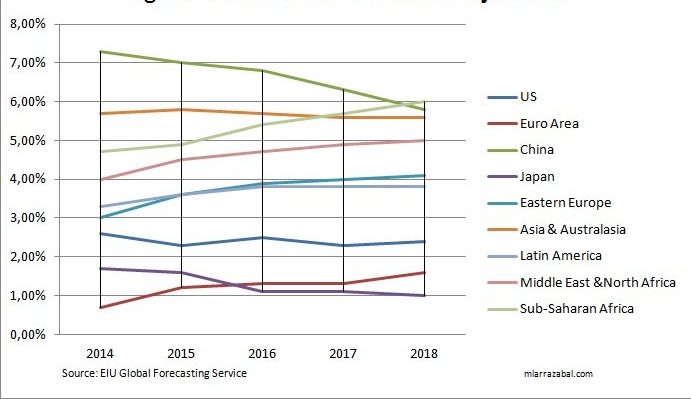
In its recently released monthly oil market report for November, OPEC adjusted higher the 2018 forecast to stand at 3.7%, compared to 3.5% in the previous month, amounting to an increase of 2 percent.
It also said global economic growth dynamic has continued its momentum, also revising upwards, forecast for 2017 to 3.7%, from 3.6% in last month’s report.
Particularly, OPEC said the Organization for Economic Cooperation and Development, OECD economic growth in 2017 was better than expected so far.
Supported by a continued strong momentum in 3Q17, OECD Gross Domestic Profit, GDP growth was revised up in 2017 to 2.3% from 2.2%; and the OECD’s 2018 GDP growth forecast was revised up to 2.2% from 2.1%. This increase was mainly supported by expectations of an ongoing strong growth dynamic in the Euro-zone and the US in the coming year, the latter of which may gain further support through a potential tax cut.
“Good momentum – and a potential tax reform – in the US, the ongoing dynamic in the Euro-zone and to some extent in Japan, solid growth in China and India and an improving situation in Russia and Brazil are supporting the growth trend in the short-term”.
In the emerging economies, China’s growth was better than expected in 2017 and consequently revised up to 6.8% for 2017 and to 6.5% in 2018.
India’s growth trend seems to be impacted by the after-effects of its reforms that were implemented in the past months.
This has led to a slight downward revision in both 2017 and 2018, but growth is expected to pick up in the coming year to reach 7.4%, after this year’s growth of 6.8%.
Brazil and Russia’s recovery will continue in 2018.
Brazil’s growth has been lifted to 0.7% in 2017, before reaching 1.5% in 2018.
Russia’s growth has been lifted to 1.8% in 2018, the same growth level as in 2017.
While the ongoing momentum could still provide some slight upside potential, numerous uncertainties prevail that – if to materialise – could unfold quickly and considerably, impacting global economic growth.
Among the most influential uncertainties in the near term are geopolitical developments, in addition to the pace of monetary policy normalisation, in combination with high debt levels in many countries and considerable valuations in asset markets. Moreover, stability in the oil market remains a key-determinant for global economic growth, according to OPEC.
Crude Oil Price Movements
The OPEC Reference Basket averaged $55.50 per barrel in October, gaining $2.06 over the previous month and reaching the highest value in more than two-and-a-half years, with a year-to-date average of $50.68/b. Crude futures also reached levels not seen since mid-2015. ICE Brent ended $2.13 higher at $57.65/b, while West Texas Intermediate NYMEX WTI increased $1.72, reaching $51.59/b, keeping the Brent-WTI spread above $6/b. Prices have been supported by rising global demand data and expectations that major producing nations will extend a deal to adjust output and bring the oil market to a balance. Hedge funds raised net long positions in NYMEX WTI and ICE Brent futures and options by 29,456 and 21,592 contracts, respectively, to 281,244 and 530,237 lots. Brent and Dubai remained in backwardation, while the WTI contango eased. Sweet/sour differentials narrowed in Asia and Europe but widened on the US Gulf Coast.
Backwardation is a situation in which the spot or cash price of a commodity is higher than the forward price, while Contango is the normal situation in which the spot or cash price of a commodity is lower than the forward price.
West Texas Intermediate, WTI, also known as Texas light sweet, is a grade of crude oil used as a benchmark in oil pricing. This grade is described as light because of its relatively low density, and sweet because of its low sulfur content.
The New York Mercantile Exchange, NYMEX is a commodity futures exchange owned and operated by CME Group of Chicago
NYMEX WTI is the most liquid commodity future in the world. So far this year the exchange-traded an average 125 million barrels per day in the prompt contract alone. The NYMEX crude price is global that it also underpins the domestic US crude spot market.
World Oil Demand
World oil demand growth is expected to rise by 1.53 million barrels per day, mb/d in 2017 after an upward adjustment of 74 thousand barrels per day, tb/d to account for the better-than-expected performance of China in 3Q17. In 2018, world oil demand is foreseen reaching 1.51 mb/d, around 130 tb/d higher than in the previous assessment.
World Oil Supply
Non-OPEC oil supply is now projected to grow by 0.65 mb/d year-on-year, y-o-y in 2017, representing a downward revision of 0.02 mb/d from last month’s report. For 2018, growth in non-OPEC oil supply has also been revised down by 0.07 mb/d to stand at 0.87 mb/d. OPEC NGLs and non-conventional liquids are expected to grow by 0.18 mb/d in 2018, following an increase of 0.17 mb/d in 2017. In October 2017, OPEC crude oil production decreased by 151 tb/d, according to secondary sources, to average 32.59 mb/d.
Product Markets and Refining Operations
Product markets in the Atlantic Basin weakened in October due to seasonally-lower gasoline demand following the end of U.S driving season. Nonetheless, U.S refining margins have exhibited some improvement y-o-y on the back of firm product demand and amid low stock levels. In Europe, solid middle-of-the-barrel demand offset weakness at the top and bottom. Product markets in Asia also weakened slightly, but remained at healthy levels, supported by the onset of refinery maintenance.
Tanker Market
Sentiment in the dirty tanker market generally strengthened in October, as freight rates for different classes showed improvements on most major trading routes. Average dirty tanker spot freight rates rose 16% compared to the previous month, on the back of improved seasonal tonnage demand, as well as port and weather delays, among other factors. Despite healthy gains in October, the shipping market remains in surplus, capping further increases in spot freight rates. Meanwhile, clean tanker freight rates experienced a relative decline, although remaining above the levels of the same month last year.
Stock Movements
Total OECD commercial oil stocks fell in September to stand at 2,985 million barrels, mb. At this level, OECD commercial oil stocks are 154 mb above the latest five-year average. Crude and products stocks indicated a surplus of around 129 mb and 25 mb, respectively, above the seasonal norm. In terms of days of forward cover, OECD commercial stocks stood at 62.3 days in September, some 1.9 days higher than the latest five-year average.
Balance of Supply and Demand
Based on the current global oil supply/demand balance, OPEC crude in 2017 is estimated at 33.0 mb/d, around 0.71 mb/d higher than in 2016. OPEC crude in 2018 is estimated at 33.4 mb/d, about 0.46 mb/d higher than in 2017.


