 Houston — The oil price collapse of the last two weeks has reached near-record territory, according to World Oil’s analysis of historical prices in constant dollars.
Back on March 9, the current slide began, when the NYMEX WTI crude futures price plunged from the $41.28/bbl level of March 6 to just $31.13/bbl.
After bouncing around in the low $30s/bbl between March 9 and March 13, the WTI futures price dipped further, to $28.70 on March 16 before plunging to only $20.37 on March 18. The price finished the week on March 20 at 22.43.
Over the last week or so, World Oil has converted monthly averages for original (nominal) crude futures prices from 1983 to early 2020 into “constant dollars,” often referred to as “today’s money.” This enables an apple-to-apple comparison of average monthly oil prices at various times over the last 37 years.
Accordingly, in constant dollars, many industry veterans might think that the era of lowest oil prices was in the back half of the 1980s, after the early-1986 price collapse.
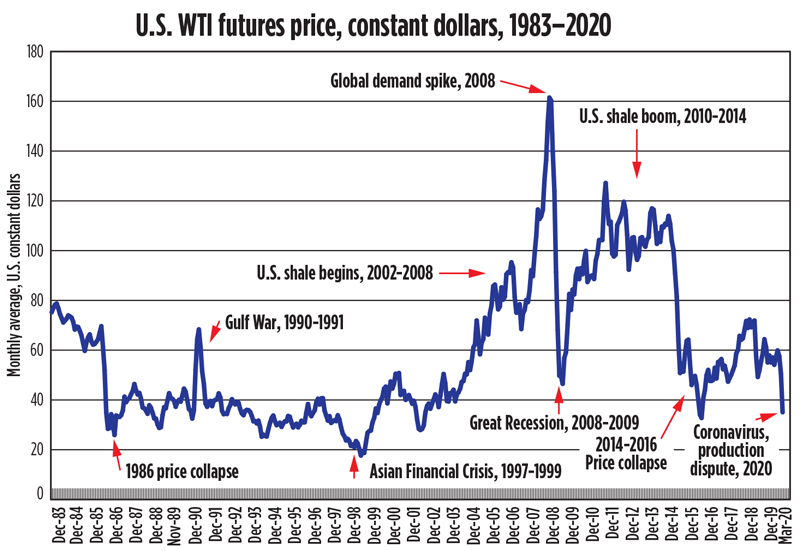
Yet, this has proven not to be true—the period of lowest prices, in constant dollars, was in late 1998 and early 1999, during the Asian Financial Crisis. In fact, the March 18, 2020, level of $20.37 is only exceeded by the December 1998, January 1999 and February 1999 monthly averages of $17.67, $19.45 and $18.69.
This can be seen clearly in the accompanying chart, showing the various highs and lows of WTI futures prices over a 37-year period.
In contrast, the lowest point that the monthly average constant dollars price fell to in the back half of the 1980s was $25.92, in July 1986.
Gulf nations, not us, to blame for oil prices fall – Russia
Our analysis shows that there have been five distinct periods of abnormally low oil prices, including the 1986 price collapse (1986-1989); the Asian Financial Crisis (1997-1999), the Great Recession of 2008-2009; the price collapse of 2014-2016; and the Coronavirus/Russian-Saudi price collapse of 2020. One could make the argument that right after the 9/11 attach in 2001, there was a noteworthy price dip, but it was of limited severity (roughly 25% drop in the worst month) and duration (only about six months).
By the same token, there have been four distinct periods of rising or elevated oil prices. These include the Gulf War (1990-1991), when Iraq invaded Kuwait, plus the period when drilling was introduced to various U.S. shale plays (2002-2008), along with the global demand spike of 2008, and the full-out U.S. shale boom of 2010-2014. In constant dollars, monthly average oil prices topped out at above $68 in October 1990; greater than $95 in July 2006; higher than $161 in June 2008; and in excess of $116 in August 2013. These rates stand in stark contrast to the current price level.


